DIKW Pyramid: A Practical Guide for Data Professionals
You have cleaned the dataset, checked your SQL and built a dashboard that answers the brief. Then, during the presentation, someone asks:
“So, what should we do?”
It is a short question, but answering it well requires more than a chart.
For data analysts, BI analysts and other data professionals, this is where technical delivery meets business judgement. To help you connect the two, the DIKW framework offers a useful way to examine your work and strengthen your contribution.
What is the DIKW pyramid?
DIKW stands for Data, Information, Knowledge and Wisdom. It is a framework for understanding how recorded facts become meaningful, how we develop understanding from them, and how that understanding supports sound decisions.
For example, think of a shop tracking its daily sales. Individual transaction records are data. When you organise those records to show that Saturday consistently attracts the most orders, you produce information. By investigating that pattern alongside footfall, promotions and staff experience, you build knowledge about what drives demand. Finally, deciding whether to adjust staffing, while considering costs, workloads and service quality, calls for wisdom.
As you move through these stages, each adds something: context makes records meaningful, investigation develops understanding, and judgement helps us choose an appropriate response. More data alone, therefore, does not guarantee a better decision.
DIKW is often drawn as a pyramid, with data at the base and wisdom at the top. The shape illustrates how understanding builds on a foundation of observations. In practice, however, the process moves back and forth: an unanswered question can send you back to collect more data, while the outcome of a decision can change what you thought you knew.
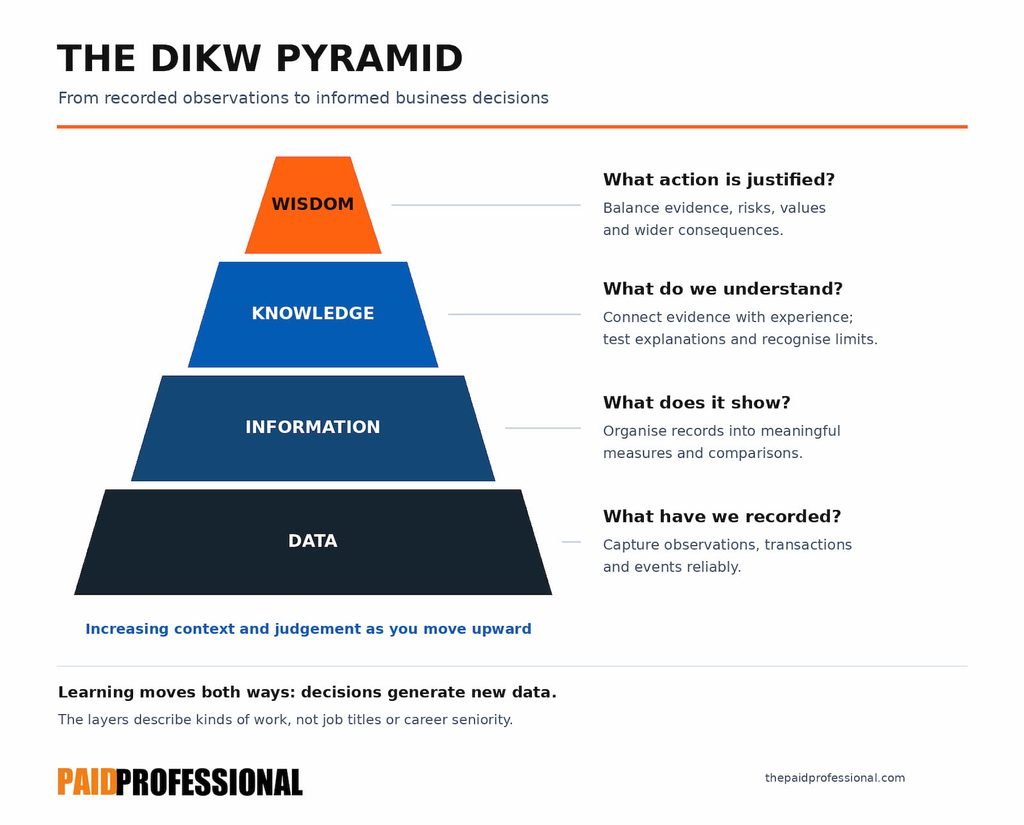
The framework has a long history in information science, including Jennifer Rowley’s examination of the DIKW hierarchy. To apply it in everyday analytical work, start with these four questions:
| Level | Working question |
|---|---|
| Data | What have we recorded? |
| Information | What does it show? |
| Knowledge | What do we understand, and how strong is the evidence? |
| Wisdom | What action is justified in these circumstances? |
Treat these as prompts for thinking. A warehouse, dashboard or job title does not belong exclusively to one level.
Let’s follow an illustrative e-commerce example: a retailer has noticed a decline in revenue and wants to understand what is happening.
1. Data: establish a trustworthy foundation
The investigation begins with records: checkout events, order values, payment failures, device types and timestamps.
An event might look like this:
User_7721 | checkout_started | mobile | 08:12:01
That record captures an observation. However, it cannot, by itself, explain whether the customer completed an order or why they left.
At this stage, the work includes data ingestion, ETL/ELT pipelines, schema validation, deduplication and data quality checks.
Before investigating the revenue decline, first check whether tracking changed. For example, are events missing? Are payment retries creating duplicates? Are time zones aligned?
These checks matter because an apparent business problem may begin as a measurement problem.
Data engineers therefore make a critical contribution through reliable pipelines, security and observability. Alongside this work, analysts need to understand the definitions and limitations of the records they use.
2. Information: make the pattern understandable
Once you have established a trustworthy foundation, you can transform those records into meaningful measures.
Using SQL and a BI tool such as Power BI, you calculate checkout completion rates by device and reporting period.
For example, your analysis might reveal:
Mobile checkout completion fell from 60% to 45%, while desktop completion remained broadly stable.
As a result, the business has a specific pattern to investigate.
Here, the terminology matters: this is a 15 percentage point decline, equivalent to a 25% relative decrease. Since these descriptions express different calculations, accuracy is essential.
Similarly, the metric needs a clear definition. Does checkout completion mean completed purchases divided by checkout starts? And how are repeat attempts handled?
To answer these questions consistently, data modelling, agreed metric definitions, measures and visualisation must work together.
A useful dashboard then gives readers enough context to interpret the result: the period, comparison, denominator and relevant segments. The GOV.UK Service Manual’s guidance on performance metrics similarly connects measurement with service purpose and action.
3. Knowledge: investigate the explanation
The dashboard has narrowed the problem. It has not established the cause.
You segment mobile performance by browser, payment method and release date. You review deployment logs with the engineering team and examine customer support feedback.
Suppose slower page loads appeared after a checkout release, alongside the decline in completion.
That supports a hypothesis:
The release may have introduced a performance issue that contributes to checkout abandonment.
However, this does not yet prove that slower pages caused the decline. Other factors, such as a payment provider issue, a change in traffic or a tracking defect, could also contribute.
Developing knowledge means testing explanations through diagnostic analysis, technical investigation and appropriate experiments.
Depending on the situation, that could involve reproducing the fault, comparing affected and unaffected groups, or evaluating a controlled fix.
The professional skill is knowing what the evidence supports—and what remains uncertain.
4. Wisdom: recommend a proportionate response
Once the evidence is sufficiently strong, the discussion turns to action.
Should the team roll back the release, apply a targeted fix or run a limited test? What risks accompany each option?
A credible recommendation might read:
Prioritise the suspected mobile checkout fault. Engineering should assess whether a rollback would remove essential fixes. If it is safe, use a staged rollback and monitor checkout completion, payment errors and revenue per checkout start.
As a result, stakeholders have a clear action, a constraint to consider and a way to evaluate the outcome.
Similarly, financial estimates need discipline. If you model potential revenue recovery, clearly state the assumptions about eligible traffic, conversion improvement and average order value. Where those assumptions introduce uncertainty, present a range to reflect the possible outcomes.
A forecast is an estimate to assess, not a promise to make.
Wisdom involves balancing evidence with cost, customer experience, security and wider consequences. An analyst contributes to that judgement alongside the people accountable for the decision.
What DIKW means for your career
It is tempting to label the pyramid “junior analyst” at the bottom and “director” at the top. However, this oversimplifies both career progression and the work involved.
A junior analyst can ask an excellent question that changes a decision. A senior engineer can create substantial value by preventing unreliable data from reaching hundreds of reports.
The useful career lesson is to understand how your work connects to its use.
Three habits can help:
Ask about the decision behind the request
Before building a report, first clarify what decision it needs to support. Then, identify who will use it and, finally, agree on what would count as success.
This helps you choose relevant measures and avoid delivering an impressive dashboard that answers the wrong question.
Separate findings from explanations and recommendations
Make the distinction visible:
- Finding: mobile checkout completion declined.
- Explanation under investigation: a release may have affected performance.
- Recommendation: validate the suspected fault and assess a staged rollback.
As a result, stakeholders can clearly distinguish between observed findings, provisional explanations and recommendations that require judgement.
Follow through after delivery
When the business acts, agree on how to evaluate the outcome.
First, assess whether performance improved. Then, check whether the fix created any new issues. Finally, determine whether the expected benefit was realised.
Those results become new data. DIKW works as an ongoing learning process, with decisions generating evidence for the next investigation.
A better question for your next project
The next time you prepare a dashboard or analytical presentation, ask:
“Have I made it clear what the evidence shows, what we still need to understand, and what decision it can support?”
By asking this question, you acknowledge the technical work behind the analysis while connecting it to its business purpose.
Over time, this connection can help colleagues trust your judgement and, in turn, involve you earlier in discussions and better understand the value of your contribution.
Can you apply DIKW at work?
Try five practical scenarios. Choose one answer per question, then check your score and explanations.
5 questions · No time limit · Your answers stay in this browser tab